Primer Used:
| 1642 | CARM1_FWD | TGGTTATCAACAGCCCCGAC | JH | 5/21/2015 | 20 | 55 | O.lurida | Histone-arginine methyltransferase CARM1 (EC 2.1.1.-) (EC 2.1.1.125) (Coactivator-associated arginine methyltransferase 1) (Protein arginine N-methyltransferase 4) | Q6DC04 | |
| 1641 | CARM1_REV | GTTGTTGACCCCAGGAGGAG | JH | 5/21/2015 | 20 | 55 | O.lurida | Histone-arginine methyltransferase CARM1 (EC 2.1.1.-) (EC 2.1.1.125) (Coactivator-associated arginine methyltransferase 1) (Protein arginine N-methyltransferase 4) | Q6DC04 |
qPCR Master Mix Reagent Table:
| Volume | Reactions X55 | |
| Ssofast Evagreen MM | 10 | 550 |
| FWD Primer | 0.5 | 27.5 |
| REV Primer | 0.5 | 27.5 |
| Nuclease Free H2O | 8 | 440 |
| cDNA | 1 |
- Added reagents from greatest to least volume
- Vortexed
- Centrifuged briefly
- Pipetted 19 ul Master Mix to each tube
- Pipetted appropriate cDNA sample to each tube
- Due to pipette error only 3 NTCs were run
- Centrifuged plate at 2000 rpm for 1 minute
- Ran Program Below
| Sybr New Plate+Sybr cDNA 60 melt 2 Read | ||
| Step | Temperature | Time |
| Initiation | 95 C | 10 min |
| Elongation | 95 C | 30 sec |
| 60 C | 1 min | |
| Read | ||
| 72 C | 30 sec | |
| Read | ||
| Repeat Elongation 39 times | ||
| Termination | 95 C | 1 min |
| 55 C | 1 sec | |
| Melt Curve Manual ramp 0.2C per sec Read 0.5 C | 55 - 95 C | 30 sec |
| 21 C | 10 min | |
| End |
Plate Layout:
| 1 | 2 | 3 | 4 | 5 | 6 | 7 |
| DNased 42215 HC1 | DNased 42215 NC1 | DNased 42215 SC1 | DNased 42215 HT1 1 | DNased 42215 NT1 1 | DNased 42215 ST1 1 | NTC |
| DNased 42215 HC2 | DNased 42215 NC2 | DNased 42215 SC2 | DNased 42215 HT1 2 | DNased 42215 NT1 2 | DNased 42215 ST1 2 | NTC |
| DNased 42215 HC3 | DNased 42215 NC3 | DNased 42215 SC3 | DNased 42215 HT1 3 | DNased 42215 NT1 3 | DNased 42215 ST1 3 | NTC |
| DNased 42215 HC4 | DNased 42215 NC4 | DNased 42215 SC4 | DNased 42215 HT1 4 | DNased 42215 NT1 4 | DNased 42215 ST1 4 | |
| DNased 42215 HC5 | DNased 42215 NC5 | DNased 42215 SC5 | DNased 42215 HT1 5 | DNased 42215 NT1 5 | DNased 42215 ST1 5 | |
| DNased 42215 HC6 | DNased 42215 NC6 | DNased 42215 SC6 | DNased 42215 HT1 6 | DNased 42215 NT1 6 | DNased 42215 ST1 6 | |
| DNased 42215 HC7 | DNased 42215 NC7 | DNased 42215 SC7 | DNased 42215 HT1 7 | DNased 42215 NT1 7 | DNased 42215 ST1 7 | |
| DNased 42215 HC8 | DNased 42215 NC8 | DNased 42215 SC8 | DNased 42215 HT1 8 | DNased 42215 NT1 8 | DNased 42215 ST1 8 |
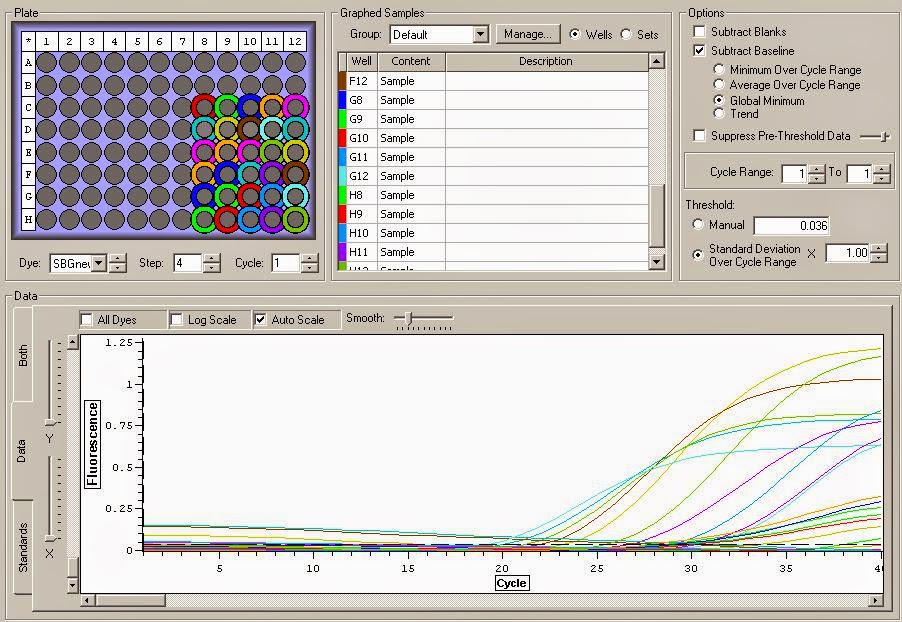
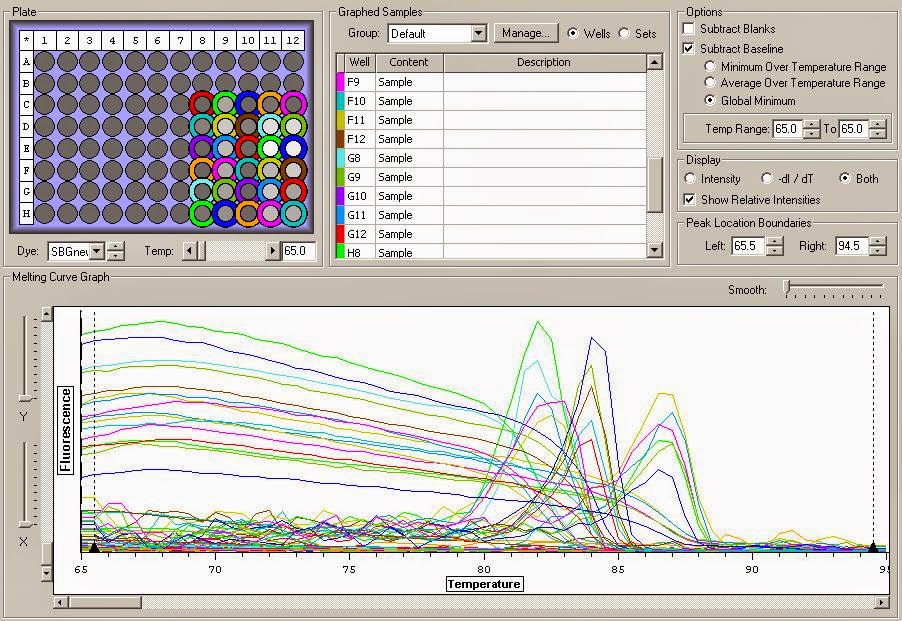
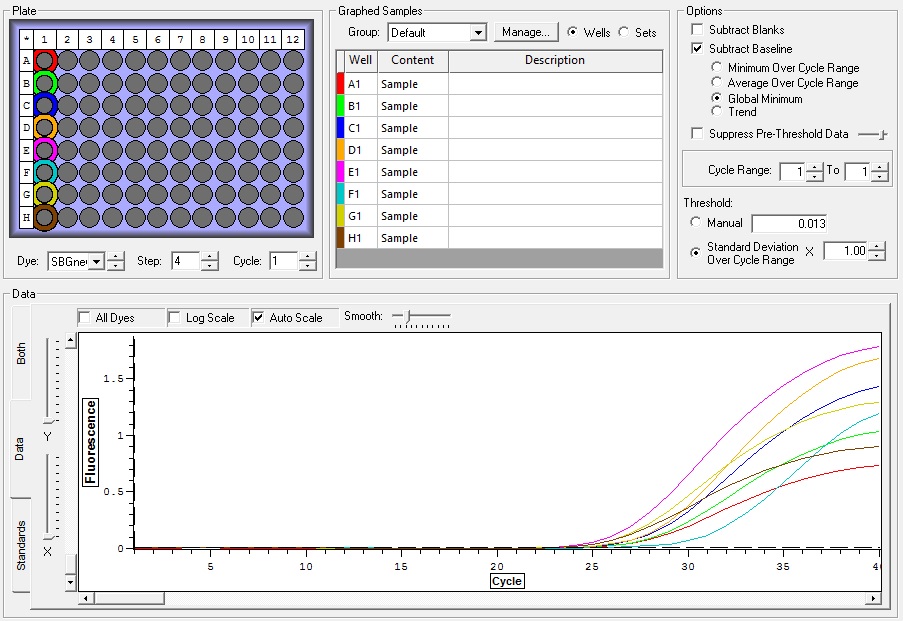
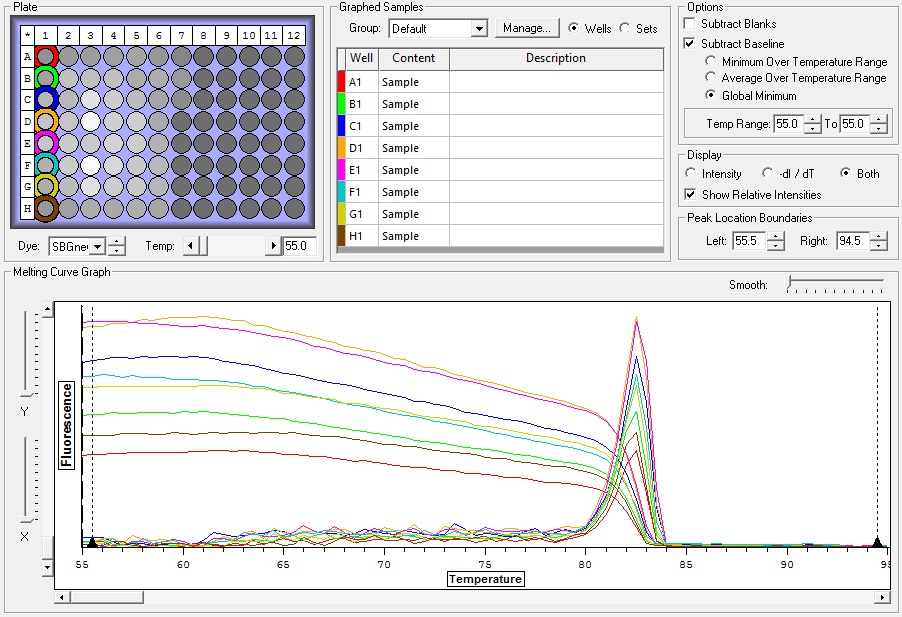
Results:
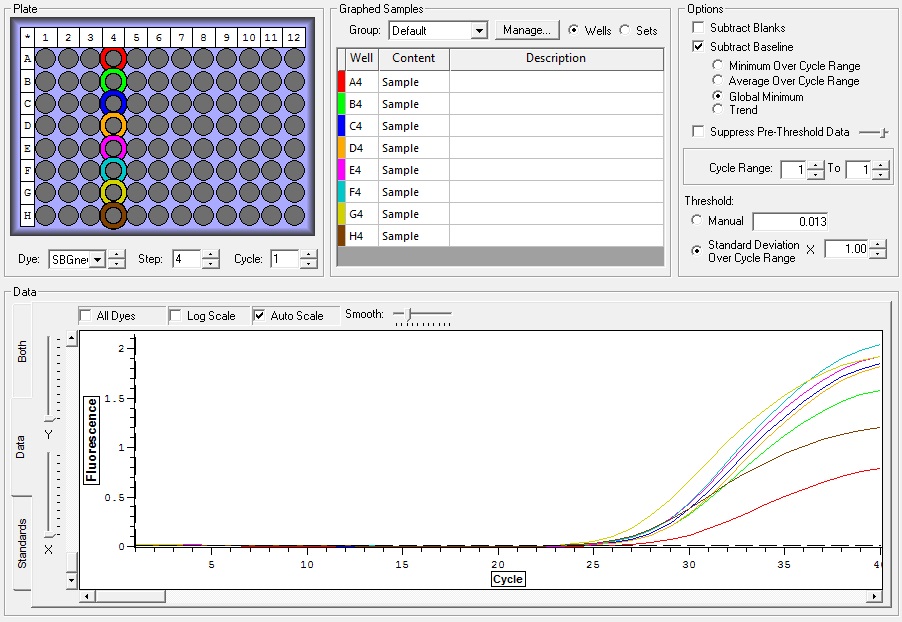
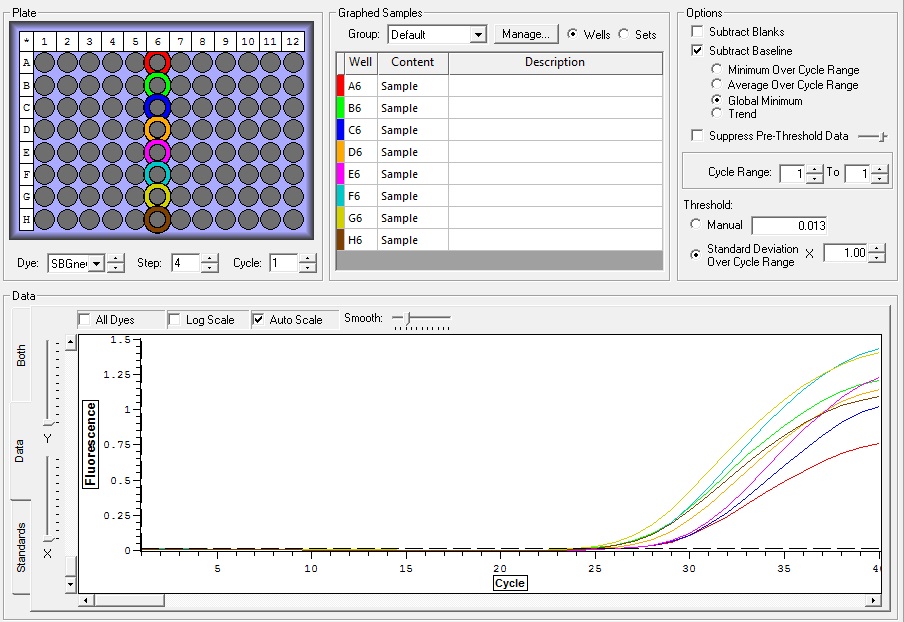
HC1-8 Amplification
NC1-8 Amplification
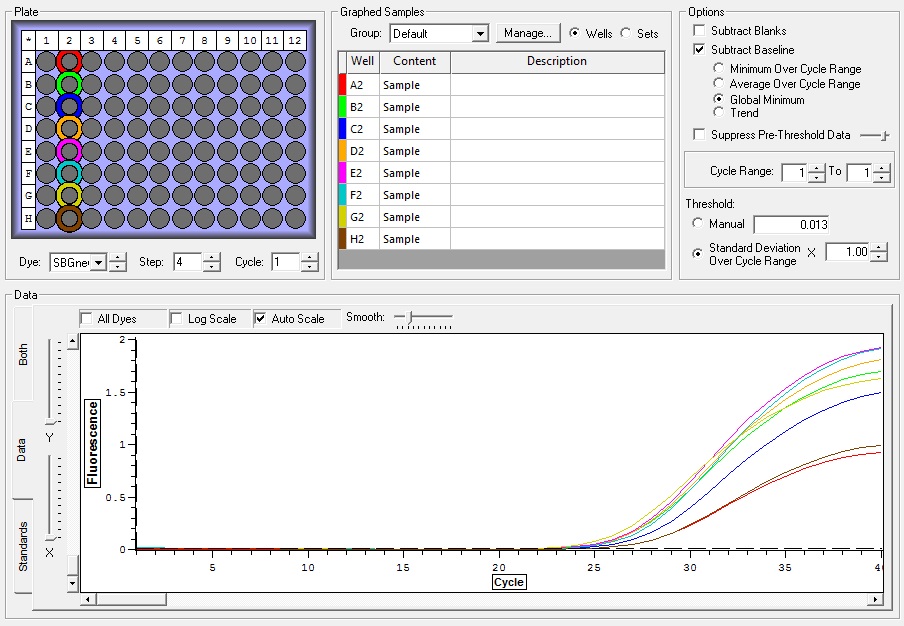
SC1-8 Amplification
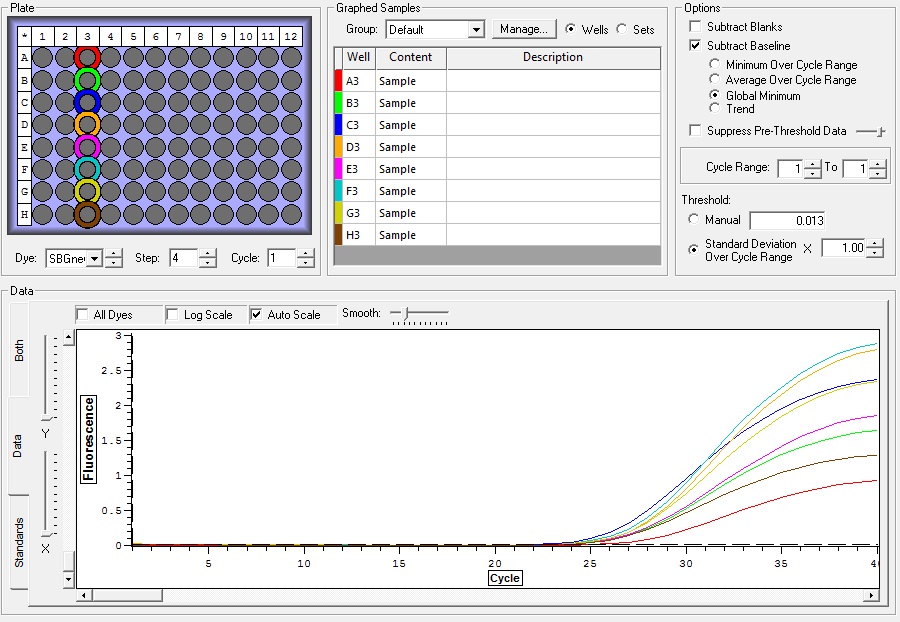
HT1-8 Amplification
NT1-8 Amplification
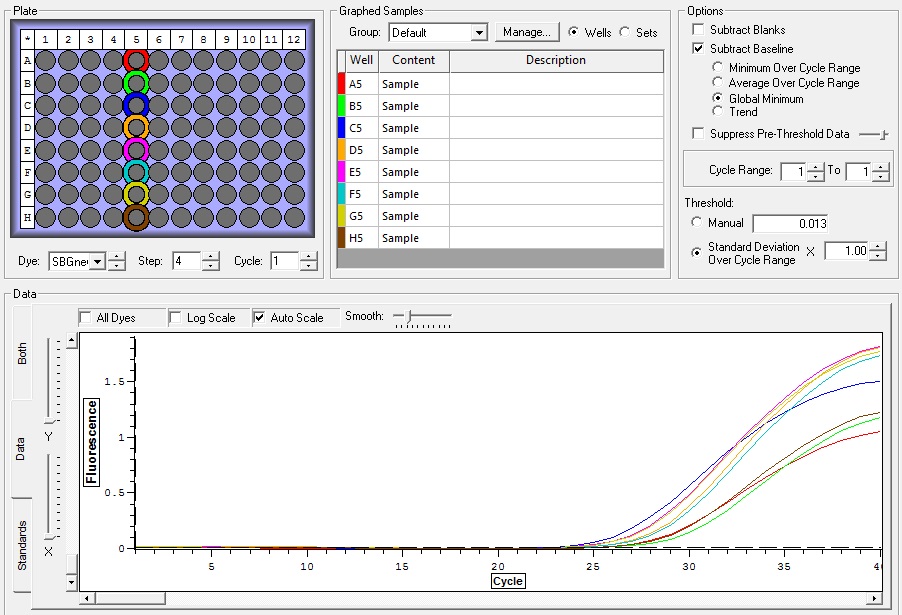
ST1-8 Amplification
NTC 1-3 Amplification
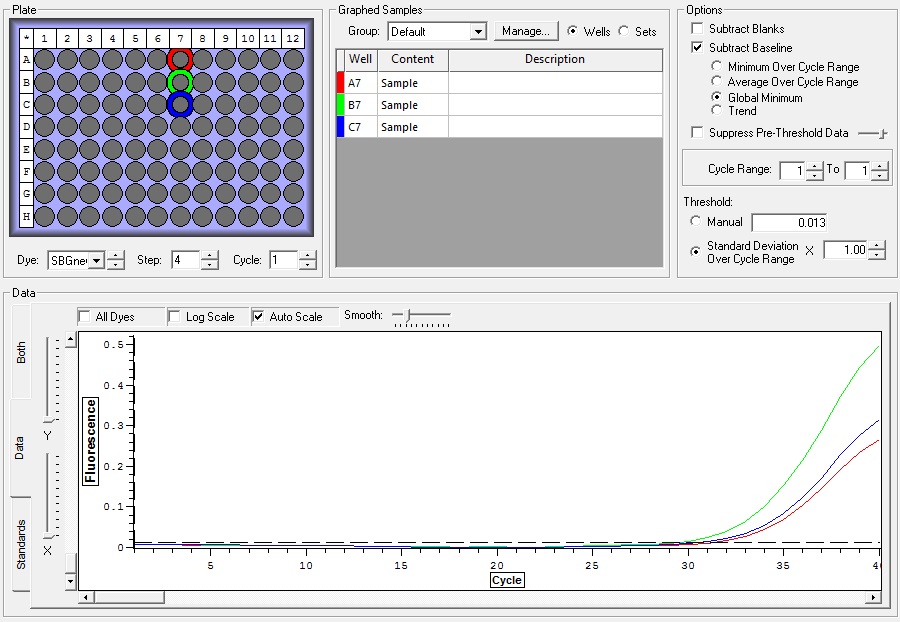
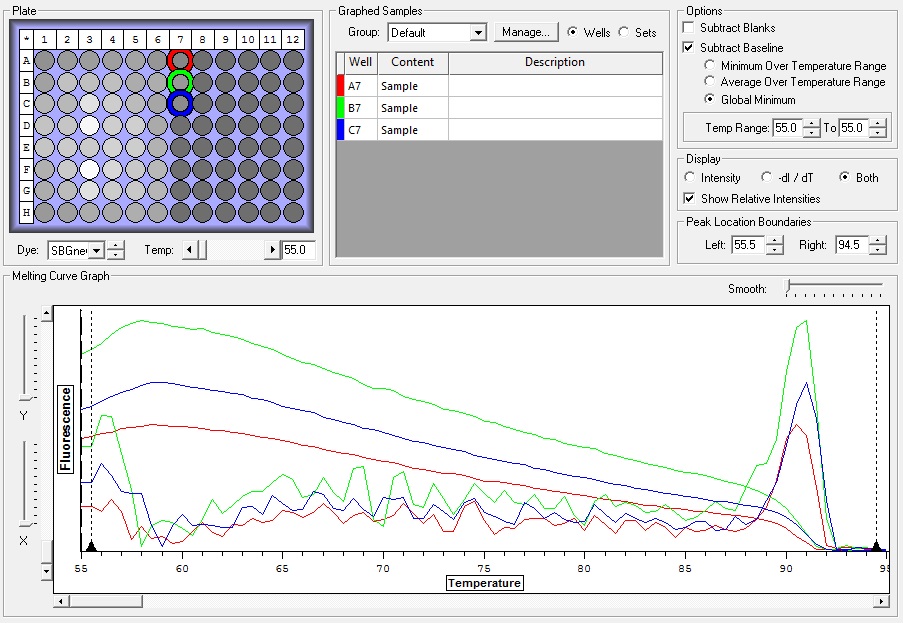
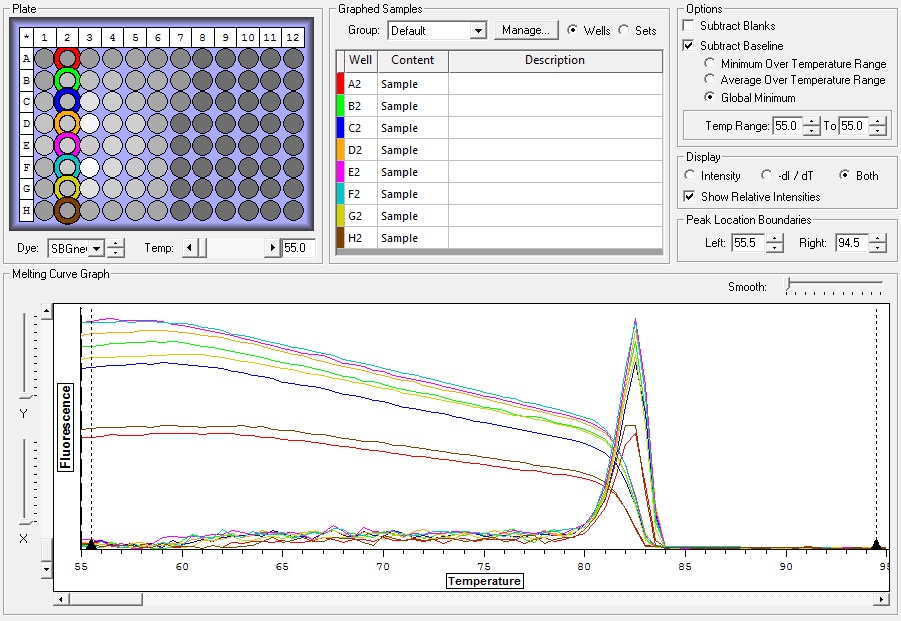
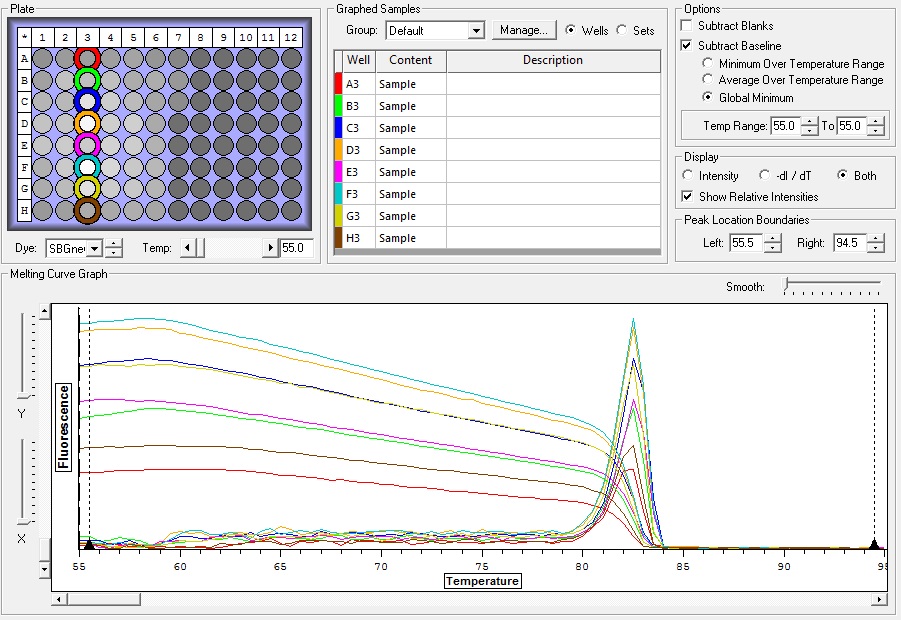
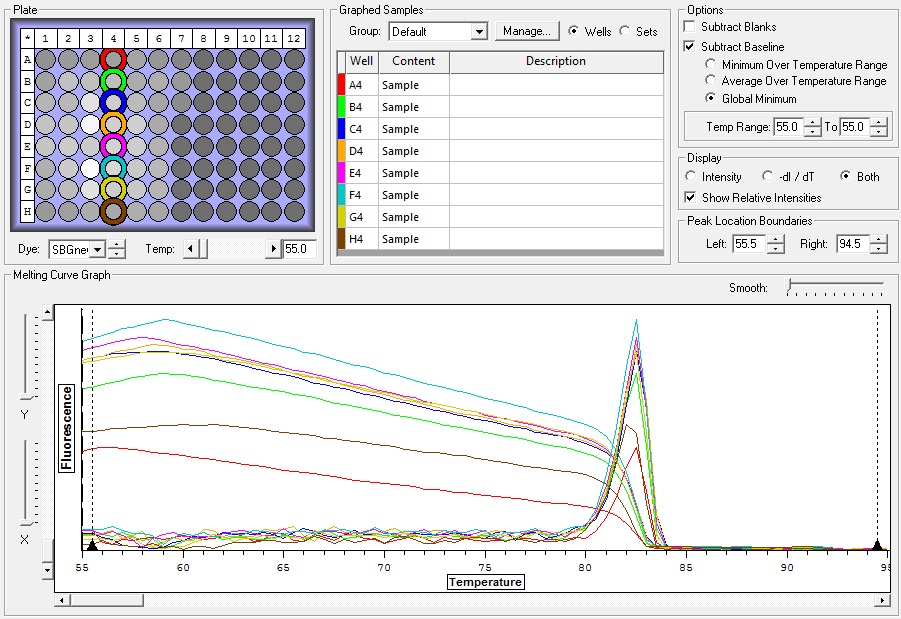
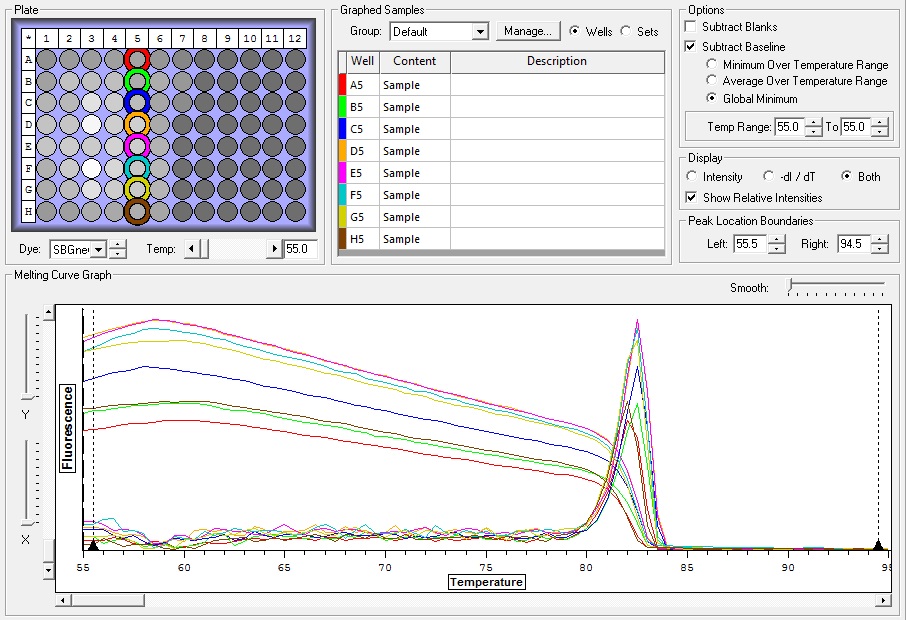
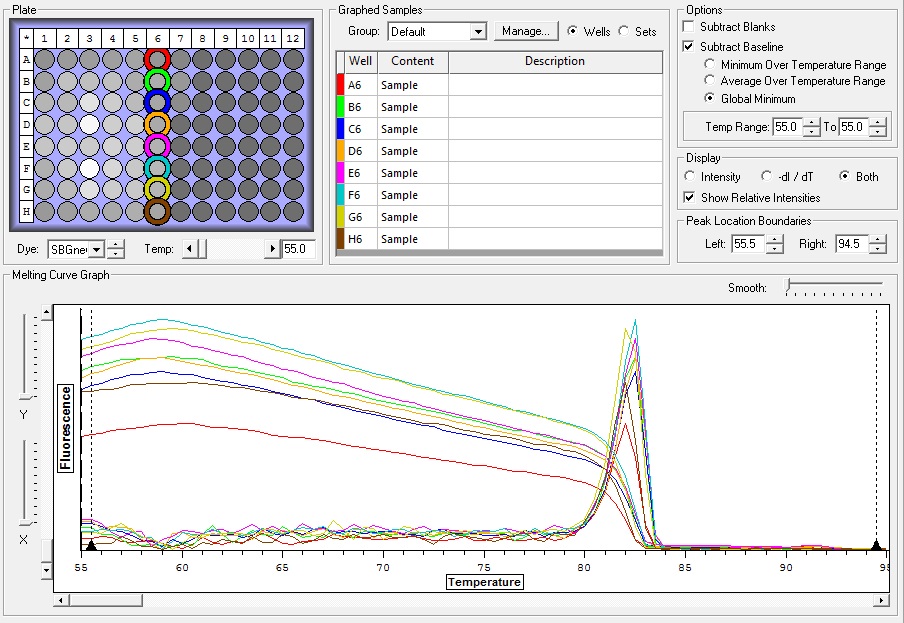
As you can see there is good amplification amoung all samples but without running the data through PCR Miner I can't distinguish a difference. Also there was some amplification in the NTC but it appears to be nonspecific with a much higher melting temp than the actual products. These high temp amplifiers don't appear in any of the other samples so I'm not worried about them as possible contamination. I've run a PCR on some more flanking primers to have them sequenced and am running a qPCR for Actin to see if we have similar results.
You can see the raw data file here.
You can see the raw data file here.